
CPR Resource Center
The most comprehensive library of emergency training resources — including videos, articles, downloads, and more.
The most comprehensive library of emergency training resources — including videos, articles, downloads, and more.
Have you ever looked at an EKG and sat and wondered what all the tracings meant and found yourself aimlessly staring at the monitor? If so, you are not alone, but there is good news. There is a 5-step process to help rapidly interpret cardiac rhythms which means you can spend less time on rhythm analysis and more time and treating the patient.
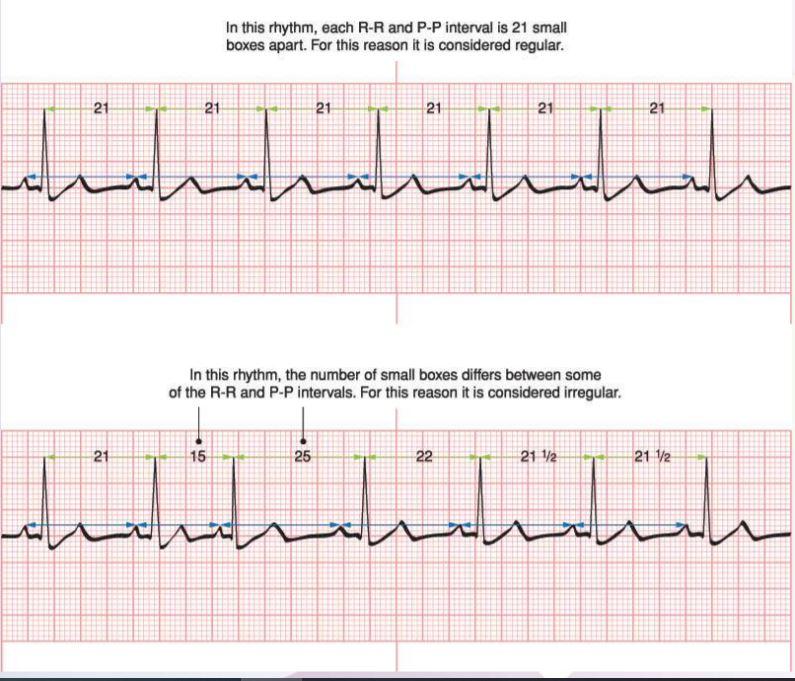
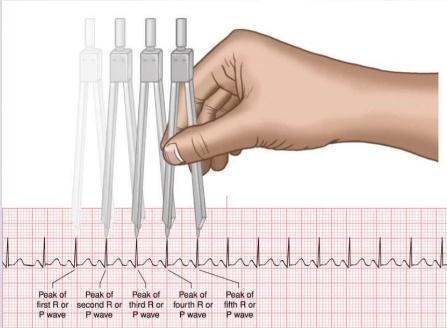
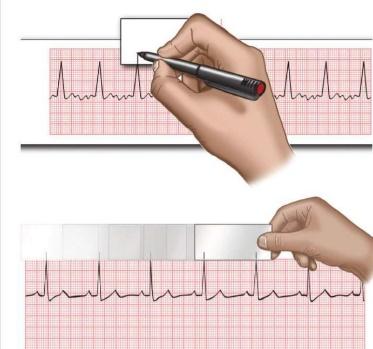
To conduct this step. Find the first cardiac complex in the ECG and locate the “QRS” complex. From there you will identify the “R” waves throughout the remainder of the ECG strip. You can make small markers above each complex for ease of identification. Next you will take telemetry calibers to trace the “R to R” intervals from the first two cardiac complexes through the remainder of the ECG strip.
Some variance is to be expected but if the variance in the tracing is considered to be greater that .12 seconds or greater than 3 small squares that that rhythm is considered to be irregular. There are few irregular rhythms so we have already narrowed our focus to specific rhythms only on step 1.
There are 3 methods to use but in short what we really want to know is: Is the rhythm fast (Tachycardia), slow (Bradycardia), or normal.
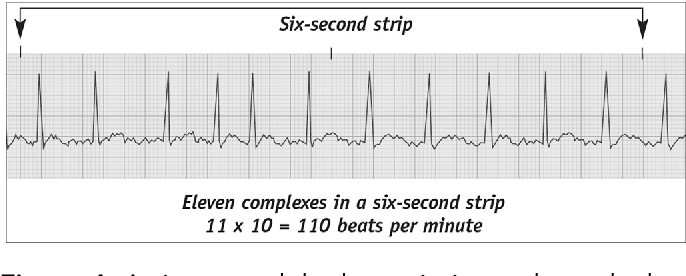
Method #1: 6 Second Method- Count number of R waves on 6 second strip and multiply by 10. Provides approximate heart rate. Fast and simple. Used for irregular and regular rhythms.
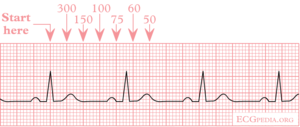
Method #2: The 300 Method- Count the number of large boxes between 2 successive R waves and divide by 300 to obtain heart rate. Only used for regular rhythms.
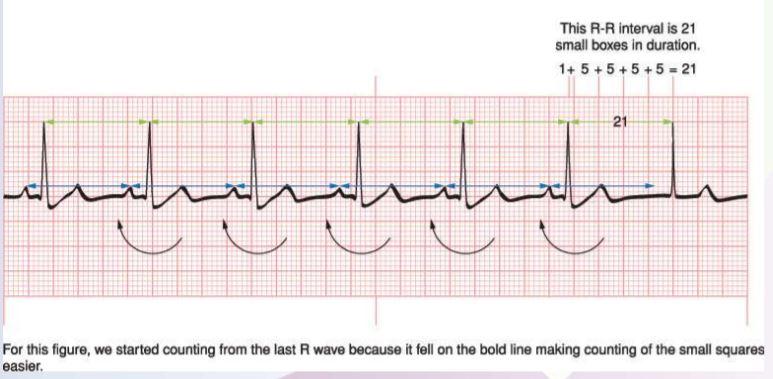
Method #3: 1500 Method- Most accurate method for regular rhythms. Count number of small squares between 2 consecutive R waves and divide into 1500. Only used for regular rhythms.
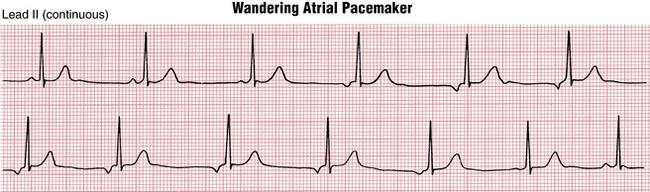
The “P” wave represents atrial depolarization. In normal sinus rhythm the “P” wave is always positive in lead II and always negative in lead aVR. We should first analyze whether or not “P” saves are present. Are they all upright and round in appearance or are some of them inverted, absent or buried in the QRS complexes? There are several rhythms such as Junctional Rhythm and Wandering Atrial Pacemaker where “P” waves may be inverted or absent. Additionally, there are rhythms that may appear to have “P” waves but they may infact be fibrillatory or flutter waves indicating atrial fibrillation or atrial flutter in which the atria is quivering or fluttering and not effectively pumping blood. Questions to ask in this step are as followed:
Are “P” waves present?
Are they round and upright in appearance?
Are they consistent or do they change in appearance throughout the strip?
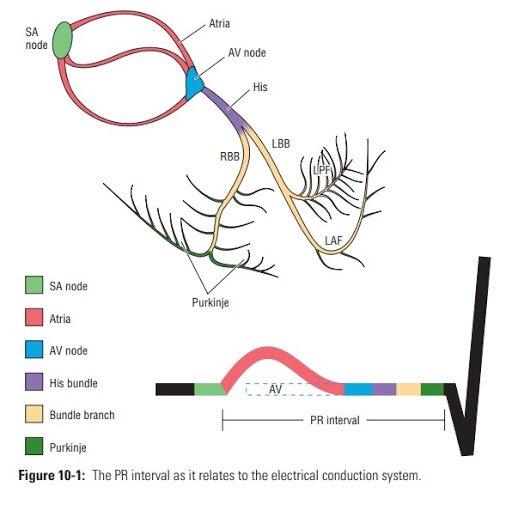
The PR interval (PRI) measures from the beginning of the “P” wave to the beginning of the “QRS” complex which measures the time of depolarization of the atria to depolarization of the ventricles and reflects a physiological delay in AV conduction imposed by the AV node. Normal range is 120 – 200 ms or 0.12 to 0.20 seconds. Questions to ask in this step are as followed:
What is the length of the “PRI”?
Is the PRI consistently the same length throughout the strip? (gradually increasing?)
Generally speaking, the “QRS” complex is the next cardiac complex in the ECG. This complex measure ventricular depolarization. This complex has a series of 3 deflections that reflect the current associated with right and left ventricular depolarization. By convention the first deflection in the complex, if it is negative, is called a Q wave. The first positive deflection in the complex is called an “R” wave. A negative deflection after an “R” wave is called an “S” wave.
A second positive deflection after the “S” wave, if there is one, is called the “R” wave. Some “QRS” complexes do not have all three deflections. Regardless of the number of waves present, they are all “QRS” complexes. The “QRS” interval is generally less than 0.10 seconds. Anything greater than 0.10 seconds may be classified as ventricular beats or bundle branch blocks and furthermore classified as “wide”. Questions to ask in this step are as followed:
What is the length of the “QRS”: Interval? (> or = 0.10 seconds?)
Are there any dropped “QRS” complexed? (P waves present but no QRS?)
This five-step process is a very rapid process to analyze an ECG and making a rapid interpretation of a rhythm and provide prompt treatment to the patient. By following these steps, you can easily use process of elimination based off of whether the rhythm is regular or irregular, how fast the rate is, if the rhythm has “P” waves, if the “PRI” is prolonged, and if the “QRS” interval to too short or too long. An EKG can tell us a significant amount of data and this 5-step process is a brief introduction to interpreting cardiac rhythms.
If you’d like to learn more, sign up for our ACLS courses. All of our ACLS courses come with a free virtual ALCS preparatory course to ensure your confidence in the information before your skills appointment.
Aehlert, B. (2006). ECGs made easy. St. Louis, MO: Elsevier Mosby.
Help Me Find a Course